Currently, almost all of the long-distance electric vehicles coming to market are equipped with the possibility of ultra-fast charging (>100 kW charging power). In a competitive comparison, the electric vehicles are often compared in a simplified manner, using the maximum charging power in kilowatts.
The P3 Charging Index (P3CI) indicates that this value itself is not quite reliable and representative to assess the realistic charging performance of electric vehicles. In practice, the time which is needed for users to recharge the actual range (or kilometers) is the most important parameter for the comparison of electric vehicles. Already at the end of 2019, P3 has set a benchmark with their first “P3 Charging Index”, enabling a realistic comparison of the ultra-fast charging performance of electric vehicles based on the actual customer use.
Compared to the first edition, the update of the P3 Charging Index has been optimized based on the developments of the electric vehicle market and the reader’s feedback. Particularly, the expansion of the charging window should be emphasized, due to increased battery capacities, especially for long-distance electric vehicles. As a result, the SoC window¹ has been extended to 10 – 80 percent. The evaluation of the long-distance suitability will be conducted with the addition of the most important criteria of the battery, the SoC after 20 minutes. Some of the vehicle’s charging curves have additionally been re-evaluated and updated within the P3CI, e.g., Tesla Model 3, VW ID.3, and the Porsche Taycan.
¹SoC = State of Charge
Charging power is not a sufficient indicator for the charging performance of electric vehicles
The maximum charging power (in kilowatts) of electric vehicles can only be reached under ideal conditions and requires, ideal temperature (~20°) and a relatively low battery SoC. Taking this into account, many reports, comparisons, and reviews specify the average charging power within a predefined charging window.
Whereas the first edition of the P3CI replicated this ideal charging window, the updated version has set the lower limit to a minimum value of ten percent resulting in a range reaching from 10 to 80 percent. The reduction of the lower limit of the SoC is beneficial for both, the technological development of the vehicles and the expansion of the fast charging infrastructure. This enables the additional potential for long-distance journeys of the customers and ensures that a lower residual range will remain when arriving at the charging station.
Comparison of maximum and average charging power of electric vehicles (kw)
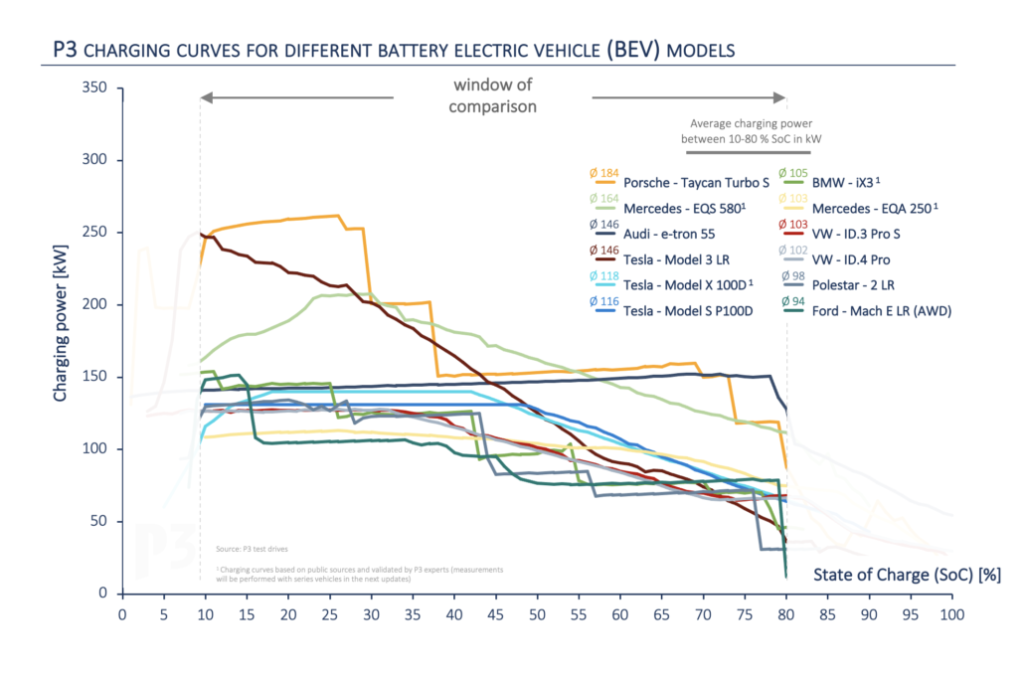
A comparison of the charging power of different vehicles shows that the maximum charging power for each vehicle can only be reached for a few minutes during the charging process. Hereby, the vehicle-specific performance varies significantly. The consideration of the average charging power within the charging window of 10 – 80 % SoC is more representative for the comparison of different charging performances of EVs. This is supported by the direct comparison of the following selected vehicles:
The Porsche Taycan Turbo S with a maximum charging power of 270 kW (manufacturer specification) achieves an average charging power of 184 kW within the selected charging window and is still clearly ahead of other electric vehicles.
Unlike the Porsche Taycan, the Mercedes-Benz EQS is not based on an 800 V architecture. However, a peak power of more than 200 kW and an average value of 164 kW can be enabled due to its high battery capacity.The maximum charging power of the Audi e-Tron is significantly lower, but can be kept at a constant average level of 146 kW during the whole charging period.
The Tesla Model 3 on the other hand, is stated by the manufacturer to reach a maximum charging power of about 250 kW at a Supercharger version 3. Realistically, it only achieves an average charging power of 146 kW, because the drop of the charging curve within the test field is greater compared to other vehicles.
The top 12 of the vehicles which have been evaluated demonstrate an average charging power of >100 kW between 10-80 % SoC, whereas the top 4 show a clear advantage with an average of >146 kW compared to others.
From a customer’s perspective, consumption and charging time must also be considered in the evaluation
However, the customer’s perspective differs, because a typical, real charging process of an EV driver is essentially oriented by two main questions:
- What range is needed to reach the next destination?
- How long does it take to recharge this range?
The second question introduces an additional important parameter that barely has been considered in previous comparisons. The real consumption of an electric vehicle, which has a direct influence on the recharged range. The recharged energy for a certain distance is directly influenced by the consumption of the vehicle. The additional consideration of the consumption enables even more realistic and user-oriented comparisons.
Consumption values of the vehicles according to WLTP and ADAC Ecotest (kwh/100km)
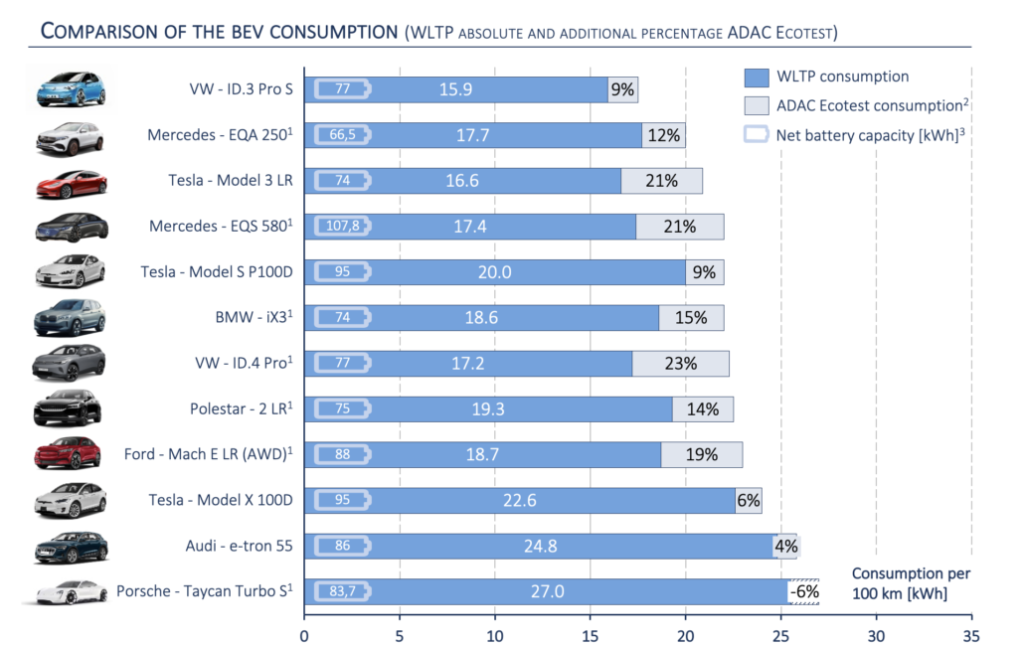
In order to assure realistic consumptions of the individual electric vehicle in the calculation of the P3 Charging Index, the ADAC Ecotest consumptions have been included in addition to the respective WLTP values. Furthermore, the battery capacity [in kWh] has been integrated into the analysis in order to determine not only the consumption but also the available energy content. The consumption together with the charging curves of the vehicles will enable us to illustrate the recharged kilometers over the required charging time. This already provides a more specific evaluation of the charging behavior of electric vehicles but is not sufficient yet to standardize the direct comparison.
The P3 charging index creates a standardized baseline for comparison
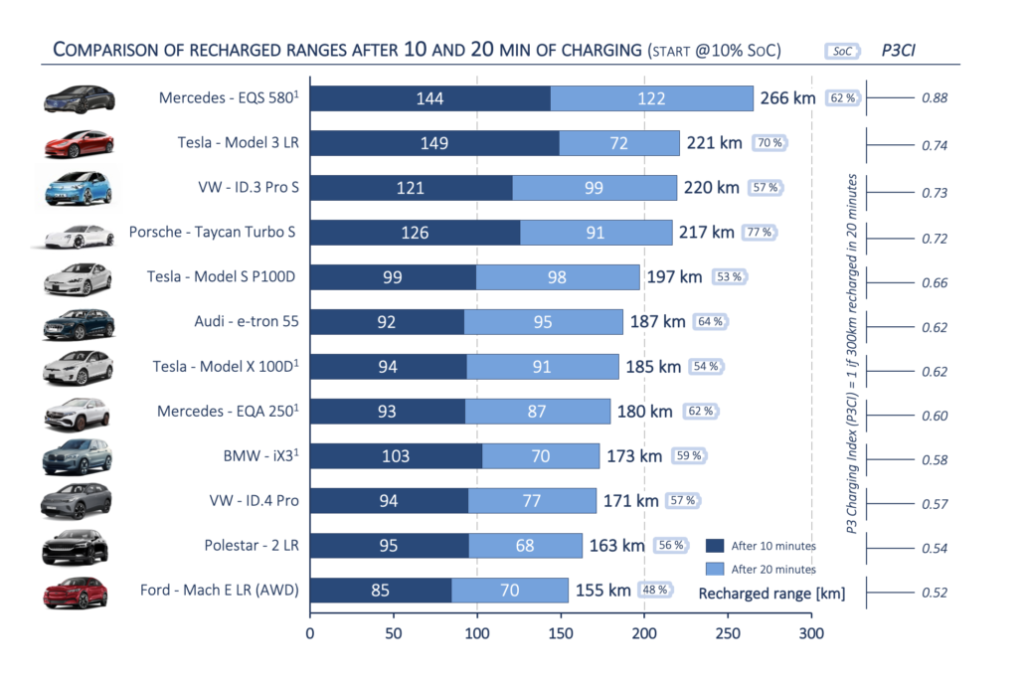
Therefore, the P3 Charging Index implements a standardization for the comparison of electric vehicles. The P3CI is the ratio of the real recharged range within 20 minutes and the target value of 300 km. The index defines the charging speed of the vehicles and leads to a significantly higher level of comparability and transparency with regard to the actual suitability of electric mobility for daily long-distance journeys.

The combination and the subsequent standardization of the charging behavior with the realistic consumption of the vehicles lead to comparable resulting values. The following index shall qualify and equally represent the suitability of a long-distance journey with an electric vehicle.
If a P3CI value of 1.0 can be achieved, this vehicle would be able to realistically recharge a driving distance of 300 km in just 20 minutes. In practice, this vehicle could drive up to 600 km with only one charging stop of 20 minutes (in the beginning of the journey, the battery must almost be fully charged). Furthermore, this form of standardization is quite user-oriented, because a short break is recommended anyway every 250-300 km.
²Charging process starting at 10% SoC
Source: Manufacturer press photos
Consideration of the recharged distances (km) within the P3 charging index
Currently, none of the electric vehicles available on the market are able to achieve an ideal value of 1.0. At least the top 4 vehicles can already reach high values of 0.72-0.88 compared to the maximum long-distance goal. In the previous report, the Porsche Taycan was with 216 km and an 800 V architecture the fastest charged vehicle within 20 minutes. In the current update, the Mercedes-Benz EQS shows an increase of 50 km up to 266 km within 20 minutes, realized by a 400 V architecture. This is also reflected in the values of the P3CI, in which the EQS is 0.88 well ahead of the Tesla Model 3 (0.74), and also has significantly increased compared to the first edition of the P3CI (Porsche Taycan with 0.72).
New vehicles, such as the Hyundai IONIQ 5, KIA EV 6, or the Audi e-tron GT on 800 V architecture, are very promising candidates to be placed under the top 5 of the P3 Charging Index ranking. Corresponding measurements will be performed by P3 and included in the P3CI, as soon as the vehicles are available. The recharged values after 10 minutes of charging are depicted as well, to ensure full transparency in the report. Taking this value into account after ten minutes of charging, the Tesla Model 3 Long Range would be ahead with 149 km, even before the Mercedes-Benz EQS in this category.
³Manufacturer’s data partly incomplete, therefore supplemented by expert estimates
Source: Manufacturer press photos
Conclusion
In the second edition, the P3 Charging Index enables again the comparison of the real and user-oriented charging performance of electric vehicles. The Index includes both, the maximum and average charging power of the vehicles, in combination with the overall efficiency, which is then standardized to a practical and realistic use case. Surprisingly, the Mercedes-Benz EQS – with 400 V architecture – reaches the best P3CI even ahead of the Tesla Model 3 and the Porsche Taycan.
Future vehicles based on an 800 V architecture are expected with great curiosity and will then, most likely, be found in the top group of the P3CI ranking.
The focus must be on a balanced ratio between charging power and efficiency of the vehicles because both parameters specify the charging experience of the customer! The feedback of the community and the readers will continue to be considered with top priority in the future development to get the most out of the P3CI and to ensure the best user-oriented comparability of the individual electric vehicles. Current vehicle updates and new releases will be added to the P3 Charging Index step-by-step.
This, of course, is always related to the vehicle and update availability at the time of testing, so that deviations may occur due to the time differences. Nevertheless, these changes will be highlighted in the upcoming releases.
As an outlook, P3 will also take into account a large number of new electric vehicles on the market. Therefore, the vehicles will be clustered according to their specific vehicle segments to further optimize the comparison.