P3 Charging Index – Report 12/19

The new generation of electric vehicles that is suitable for long distances arrives with a possibility for ultra fast charging (more than 100 kW charging capacity) on the market.

The competitive comparison of different electric vehicles is often simplified in this context by describing the ‘maximum charging capacity’. In the following we will show that this value alone has little significance for evaluating a real charging speed of electric vehicles.

In real use, the time with which actual range (or kilometers) can be recharged is the decisive performance parameter for comparing electric vehicles. For this purpose, P3 has developed the ‘Charging Index’ which enables a real comparison of the charging capacity of electric vehicles on a usage-related basis.

Charging capacity is not a sufficient indicator for the charging performance of electric vehicle

The maximum charging capacity (in kilowatt) of electric vehicles can only be reached under ideal conditions and requires that the vehicle also, among others, usually has a very low battery level. In order to take this into account, many reports and comparisons now also indicate the average charging capacity in a defined charging range of the battery. This ‘ideal’ charging range, or ‘State of Charge (SoC)’, is usually between 20-80 % of the total battery capacity. The lower barrier results from the driving behavior of the users as they develop a feeling for the remaining capacity of their vehicle and want to avoid running out of range by earlier recharging the battery. Once most vehicles have reached 80 % battery charge, the charging capacity is usually strongly reduced to protect the battery, so further recharging takes a lot of time.

Maximum and average charging performance of electric vehicles in comparison (kw)

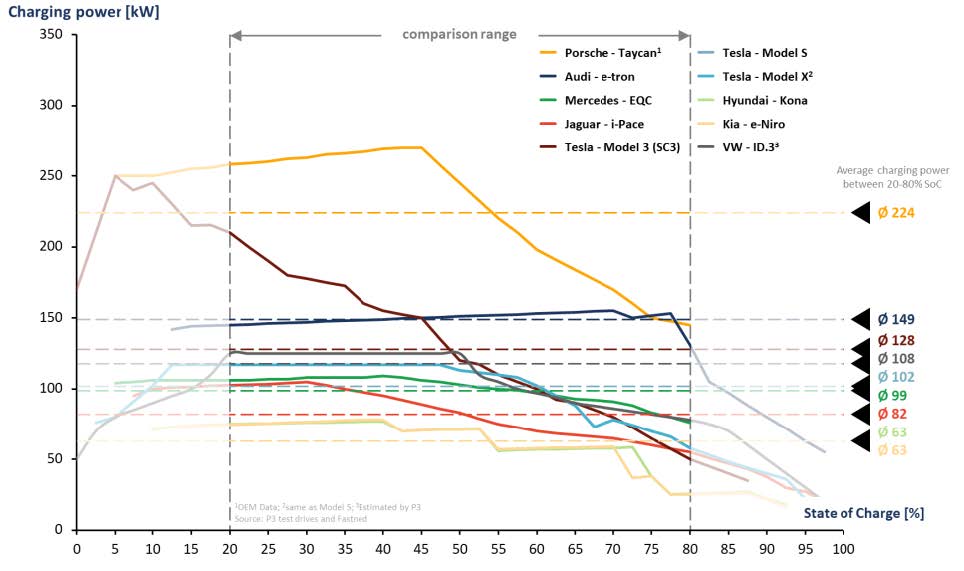
The comparsion of the charging capacity of the various vehicles shows that in addition, the maximum possible charging capacity in each case can only be reached for a few minutes during the charging process – the specific performance of the vehicles varies here as well. Therefore, the average charging capacity in a ‘charging window’ of 20-80 % SoC is much more representative to compare the charging speed of the vehicles with each other. This is illustrated by the concrete comparison of selected vehicles:

Maximum and average charging performance of electric vehicles in comparison

The Porsche Taycan with a maximum charging capacity of 270 kW (manufacturer’s specification) achieves an average charging capacity of 224 kW in the charging window and is thus well ahead of the other vehicles. The Audi e-tron with a maximum charging capacity of 155 kW, however, maintains this capacity almost over the whole regarded period and achieves an average charging capacity of 149 kW. The Tesla Model 3 on the other hand is specified by the manufacturer with a maximum charging capacity of around 250 kW on a Supercharger Version 3, but reaches a charging capacity of only 128 kW in average, as this vehicle shows the fasted reduction of charging capacity during the charging process in the entire test field.
Consumption and charging duration must also be considered for the evaluation from the customer’s perspective

However, from the customer’s perspective, a different picture emerges because a typical, real charging process today is essentially oriented towards two important questions for the electric vehicle driver:

What range is needed to get to the next stop or destination?
How long will it take for the charging process to recharge for this range?

The second question introduces another important parameter into the analysis which is rarely considered in many comparisons or tests; the actual consumption of the electric vehicle, which has a direct influence on the recharged range. This is because the recharged amount of energy is sufficient for a certain mileage depending on the vehicle’s consumption. The direct inclusion of the consumption leads to a significantly more realistic and ‘use case’ comparisons.

Consumption values of the vehicles according to wltp and adac ecotest (kwh/100km)

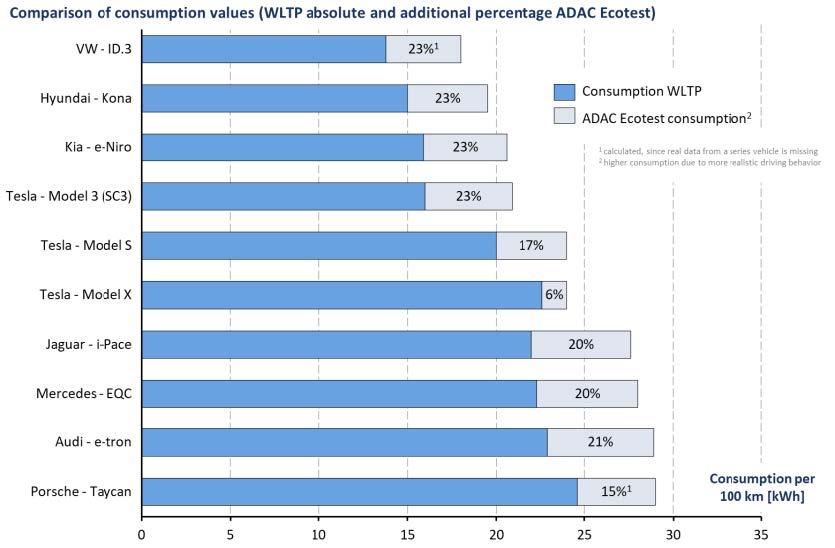
In order to include the most realistic consumption values of the individual electric vehicles in the calculation for the P3 Charging Index, surcharges based on the ADAC Ecotest were added to the respective WLTP consumption values. With the consumption and charging curves of the vehicles, now the recharged kilometers can be displayed over the time required for recharging. This already enables a more precise evaluation of the vehicles’ charging behavior, but it is not sufficient yet to directly compare electric vehicles without standardization.
Consumption values of the vehicles according to WLTP and ADAC Ecotest [kWh/100km]

P3 charging index creates uniform basis for comparison

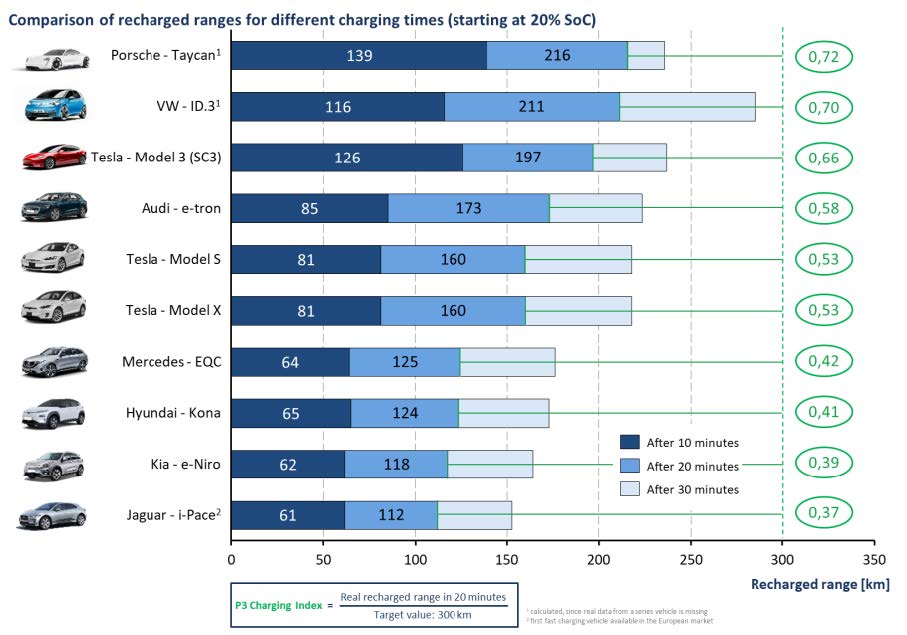
The P3 Charging Index sets a standardization. As a quotient of actual recharged range in a time period of 20 minutes to a target value of 300 km recharged range, the P3 Charging Index defines the charging speed of vehicles and leads to a significantly higher comparability and therefore to more transparency regarding the real suitability for everyday use of electric vehicles on long distances.

If the charging behavior of the vehicles is combined with the realistic consumption values and this charging behavior is standardized, comparative values are obtained for the respective vehicles. This comparative value should be equally representative for the unrestricted long-distance suitability of vehicles.

Should an electric vehicle reach the P3 Charging Index of 1.0, in practice the vehicle would be able to charge a range of 300 km in only 20 minutes. Such a vehicle could be driven for up to 600 km with a single charging stop of 20 minutes (if the battery is fully charged at the start). This form of standardization is also very practical as every typical long-distance driver would take a short break at least every 250-300 km anyway.

1 Charging process starts at 20 % SoC

Recharged ranges (km) with introduction of the p3 charging index

None of the currently available electric vehicles in the market reaches the optimal value of 1.0. Still, the top 3 vehicles achieve already high values of more than 65 % of the maximum long-distance use value. In practice, this means that in individual cases the electric vehicle driver need must calculate with one or more charging stops on long-distance trips. It can be clearly seen that the newer vehicles of German manufacturers will probably be sorted high up in the field2. Electric vehicles of the earlier generations can be found in the lower field due to their lower charging capacities and (consumption) efficiency.

In order to secure full transparency, the recharged ranges after 10 and 30 minutes are also depicted.
2 Manufacturer specifications partly incomplete, thus complemented by expert estimates

Comparison of recarged ranges

Next steps

In regular updates, we will publish new vehicles in the P3 Charging Index and also make updates of already introduced vehicles. So in the next release, besides the real values of the Porsche Taycan, an update of the Tesla Model 3 will certainly be available. Furthermore, vehicles like the Peugeot e208 or the Opel Corsa-e will be measured and will be rated with the corresponding index by then. With the help of the P3 Charging Index, we initially wanted to create transparency and traceability in an electric vehicle market that is still far too opaque in the discussion of rapid charging capability today.

Since not every electric vehicle will be launched on the market in the future with the claim to be suitable for long-distance travel and thus serve a different customer use case, we will extend the index to other vehicle segments. In addition, classic vehicle segments will be separated as soon as a correspondingly comparable number of vehicles exists – this is to avoid the compact class having to compare itself with the sports segment. We are already working to ensure that we compare vehicles that are more focused on urban areas with other target figures, but that we want to offer at least the same transparency and traceability.

Conclusion

The P3 Charging Index enables the comparison of actual and realistic charging performances of electric vehicles. It considers the maximum or average charging capacity of the vehicles as parameter, combines it with the overall efficiency of the respective vehicle and standardizes these key figures to a practical and driver-related use case.

The P3 Charging Index also makes a claim on the development of electric vehicles: In the future, the development of vehicles should focus on a corresponding mix between charging performance and efficiency of the vehicle, because only the sum of both parameters defines the customer’s charging experience!

Authors

Christian Daake

Markus Hackmann

SHARE ARTICLE

Latest Updates

P3 Charging Index – Report 12/19

The new generation of electric vehicles that is suitable for long distances arrives with a possibility for ultra fast charging (more than 100 kW charging capacity) on the market.

The competitive comparison of different electric vehicles is often simplified in this context by describing the ‘maximum charging capacity’. In the following we will show that this value alone has little significance for evaluating a real charging speed of electric vehicles.

In real use, the time with which actual range (or kilometers) can be recharged is the decisive performance parameter for comparing electric vehicles. For this purpose, P3 has developed the ‘Charging Index’ which enables a real comparison of the charging capacity of electric vehicles on a usage-related basis.

Charging capacity is not a sufficient indicator for the charging performance of electric vehicle

The maximum charging capacity (in kilowatt) of electric vehicles can only be reached under ideal conditions and requires that the vehicle also, among others, usually has a very low battery level. In order to take this into account, many reports and comparisons now also indicate the average charging capacity in a defined charging range of the battery. This ‘ideal’ charging range, or ‘State of Charge (SoC)’, is usually between 20-80 % of the total battery capacity. The lower barrier results from the driving behavior of the users as they develop a feeling for the remaining capacity of their vehicle and want to avoid running out of range by earlier recharging the battery. Once most vehicles have reached 80 % battery charge, the charging capacity is usually strongly reduced to protect the battery, so further recharging takes a lot of time.

Maximum and average charging performance of electric vehicles in comparison (kw)

The comparsion of the charging capacity of the various vehicles shows that in addition, the maximum possible charging capacity in each case can only be reached for a few minutes during the charging process – the specific performance of the vehicles varies here as well. Therefore, the average charging capacity in a ‘charging window’ of 20-80 % SoC is much more representative to compare the charging speed of the vehicles with each other. This is illustrated by the concrete comparison of selected vehicles:

Maximum and average charging performance of electric vehicles in comparison

The Porsche Taycan with a maximum charging capacity of 270 kW (manufacturer’s specification) achieves an average charging capacity of 224 kW in the charging window and is thus well ahead of the other vehicles. The Audi e-tron with a maximum charging capacity of 155 kW, however, maintains this capacity almost over the whole regarded period and achieves an average charging capacity of 149 kW. The Tesla Model 3 on the other hand is specified by the manufacturer with a maximum charging capacity of around 250 kW on a Supercharger Version 3, but reaches a charging capacity of only 128 kW in average, as this vehicle shows the fasted reduction of charging capacity during the charging process in the entire test field.

Consumption and charging duration must also be considered for the evaluation from the customer’s perspective

However, from the customer’s perspective, a different picture emerges because a typical, real charging process today is essentially oriented towards two important questions for the electric vehicle driver:

What range is needed to get to the next stop or destination?
How long will it take for the charging process to recharge for this range?

The second question introduces another important parameter into the analysis which is rarely considered in many comparisons or tests; the actual consumption of the electric vehicle, which has a direct influence on the recharged range. This is because the recharged amount of energy is sufficient for a certain mileage depending on the vehicle’s consumption. The direct inclusion of the consumption leads to a significantly more realistic and ‘use case’ comparisons.

Consumption values of the vehicles according to wltp and adac ecotest (kwh/100km)

In order to include the most realistic consumption values of the individual electric vehicles in the calculation for the P3 Charging Index, surcharges based on the ADAC Ecotest were added to the respective WLTP consumption values. With the consumption and charging curves of the vehicles, now the recharged kilometers can be displayed over the time required for recharging. This already enables a more precise evaluation of the vehicles’ charging behavior, but it is not sufficient yet to directly compare electric vehicles without standardization.

Consumption values of the vehicles according to WLTP and ADAC Ecotest [kWh/100km]

P3 charging index creates uniform basis for comparison

The P3 Charging Index sets a standardization. As a quotient of actual recharged range in a time period of 20 minutes to a target value of 300 km recharged range, the P3 Charging Index defines the charging speed of vehicles and leads to a significantly higher comparability and therefore to more transparency regarding the real suitability for everyday use of electric vehicles on long distances.

If the charging behavior of the vehicles is combined with the realistic consumption values and this charging behavior is standardized, comparative values are obtained for the respective vehicles. This comparative value should be equally representative for the unrestricted long-distance suitability of vehicles.

Should an electric vehicle reach the P3 Charging Index of 1.0, in practice the vehicle would be able to charge a range of 300 km in only 20 minutes. Such a vehicle could be driven for up to 600 km with a single charging stop of 20 minutes (if the battery is fully charged at the start). This form of standardization is also very practical as every typical long-distance driver would take a short break at least every 250-300 km anyway.

1 Charging process starts at 20 % SoC

Recharged ranges (km) with introduction of the p3 charging index

None of the currently available electric vehicles in the market reaches the optimal value of 1.0. Still, the top 3 vehicles achieve already high values of more than 65 % of the maximum long-distance use value. In practice, this means that in individual cases the electric vehicle driver need must calculate with one or more charging stops on long-distance trips. It can be clearly seen that the newer vehicles of German manufacturers will probably be sorted high up in the field2. Electric vehicles of the earlier generations can be found in the lower field due to their lower charging capacities and (consumption) efficiency.

In order to secure full transparency, the recharged ranges after 10 and 30 minutes are also depicted.

2 Manufacturer specifications partly incomplete, thus complemented by expert estimates

Comparison of recarged ranges

Next steps

In regular updates, we will publish new vehicles in the P3 Charging Index and also make updates of already introduced vehicles. So in the next release, besides the real values of the Porsche Taycan, an update of the Tesla Model 3 will certainly be available. Furthermore, vehicles like the Peugeot e208 or the Opel Corsa-e will be measured and will be rated with the corresponding index by then. With the help of the P3 Charging Index, we initially wanted to create transparency and traceability in an electric vehicle market that is still far too opaque in the discussion of rapid charging capability today.

Since not every electric vehicle will be launched on the market in the future with the claim to be suitable for long-distance travel and thus serve a different customer use case, we will extend the index to other vehicle segments. In addition, classic vehicle segments will be separated as soon as a correspondingly comparable number of vehicles exists – this is to avoid the compact class having to compare itself with the sports segment. We are already working to ensure that we compare vehicles that are more focused on urban areas with other target figures, but that we want to offer at least the same transparency and traceability.

Conclusion

The P3 Charging Index enables the comparison of actual and realistic charging performances of electric vehicles. It considers the maximum or average charging capacity of the vehicles as parameter, combines it with the overall efficiency of the respective vehicle and standardizes these key figures to a practical and driver-related use case.

The P3 Charging Index also makes a claim on the development of electric vehicles: In the future, the development of vehicles should focus on a corresponding mix between charging performance and efficiency of the vehicle, because only the sum of both parameters defines the customer’s charging experience!

Authors

Christian Daake

Markus Hackmann

Simon Jung

TAGS

SHARE ARTICLE

Latest Updates